How can you tell if your call center is performing well? What data do you need to know how things are running?
To find the answer to these questions, you need to look at what is called call center performance metrics.
Call Center Performance Metrics: Meaning and Why They Matter
Call center performance metrics are a standard set of measurements businesses use to evaluate a call center or contact center’s performance. Managers of call centers use them to improve customer satisfaction, agent productivity, and operational efficiency.
Contact centers exist for more than just answering questions, making a sale, or taking a complaint and resolving the issue. Their main purpose is to help customers stay loyal by meeting their customer support expectations. Even 95% of contact center professionals agree that customer satisfaction is the most important call center metric.
Call center analytics reveal KPIs (short for key performance indicators) like call lengths, peak call hours, first contact resolution, repeat calls, first response time, and the total time agents spend dealing with customers over phone calls, social media, email, chat, etc.
Together with performance benchmarking, regular monitoring of call center KPIs may reveal potential issues that can hurt the customer’s experience, increasing churn rates as a result. In due course, call center analytics helps in the early detection of emerging trends so that problems can be solved early and processes can be optimized.
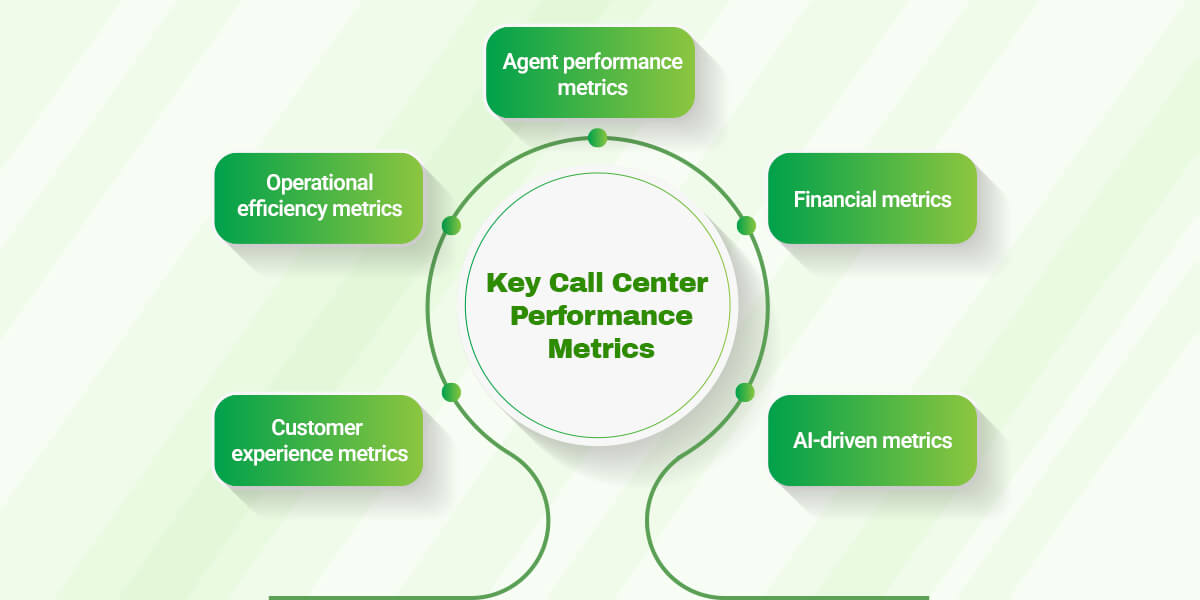
Key call center performance metrics
There are various call center performance metrics that can broadly be categorized into customer experience metrics, operational efficiency metrics, agent performance metrics, and financial metrics.
Customer experience metrics
1) Customer satisfaction score (CSAT)
Customer satisfaction score (CSAT) is a measurement of the customer’s satisfaction with a company’s products or services.
CSAT data is gathered through customer surveys containing simple, direct questions like “How satisfied are you with [product/service]?” with a 1-5 or 1-10 rating scale. Once you have the data, you have to calculate the CSAT score.
Here’s how you calculate the CSAT score:
- First, find the total number of survey respondents.
- Second, find the total number of satisfied customers, namely those who responded positively with either “very satisfied” or “somewhat satisfied” in the survey.
- Third, divide the total number of satisfied customers by the total number of respondents and multiply the result by 100 to turn it into a percentage.
The resulting percentage is your CSAT score.
Generally speaking, any percentage above 70% is considered a good customer satisfaction score. Anything below 50% is not desirable. The average CSAT score across all industries is about 78%.
2) Net promoter score (NPS)
Net promoter score, or NPS, is a measurement of a customer’s loyalty and satisfaction. It is measured by asking the customer how likely they are to recommend your product or service to others, usually on a 1 to 10 scale- 1 being “not likely at all” and 10 being “extremely likely”. The customers are categorized as promoters (9-10), passives (7-8), and detractors (0-6) based on their answers.
You can calculate NPS by deducting the detractors percentage from the promoters percentage. NPS scores help businesses improve their service, customer support, delivery, etc., which then improves customer loyalty. For example, omnichannel support is one answer to making customers feel that they can get in touch with a company through any means. It makes them feel that your business is always accessible to them, which increases their preference for your products/services. According to research, companies with strong omnichannel customer engagement, on average, are able to retain around 89% of their customers. For companies with weaker omnichannel engagement, the retention rate is only about 33%.
3) Customer effort score (CES)
Customer Effort Score measures how easy it is for a customer to use a product or service. The score is obtained from customer satisfaction surveys. It reflects the amount of effort a customer had to exert to use a product/service, find the information they needed, or have a problem resolved for them.
Some examples of a customer effort score are:
- “How easy was it to interact with [name of company]?” – with a 1 to 5 scale, 1 being “not easy at all” and 5 being “effortless.”
- “[Name of the company] made it easy for me to solve my [issue].”
The higher the CES, the better it is, as it indicates that the customer finds it very easy to deal with your product/service or customer support. A low CES means that the customer finds it difficult to deal with your company.
Operational efficiency metrics
1) First call resolution (FCR)
First call resolution (also called first contact resolution) is a metric that measures the percentage of customer issues that are resolved fully during the very first interaction with customer service. FCR helps understand how quickly the agents are able to solve customer issues and minimize follow-up contacts.
The industry standard for FCR is about 70% to 79% and anything below 70% needs improvement.
How to improve FCR for better customer satisfaction
- Introduce self-service options like chatbots, IVR, etc., so customers only have to call if they need more help.
- Get as much customer information as possible to increase the likelihood that the agent will resolve the issue in the first contact itself.
- Provide clear instructions to the customer so they don’t have to make a follow-up call.
- Have the agent walk the customer through the resolution so they can solve the issue themselves the next time the problem occurs.
- Do a final check-in before closing the call by asking questions like “Have I fully resolved your issue?” or “Is there any other issue I can help with?” or “Can I consider this issue as resolved?”
- Regularly evaluate service calls, emails, chats, etc., to check for room for improvement.
2) Average handle time (AHT)
Every customer’s time is precious; so is yours. The quicker you close their queries, the better it is for you and the customer. Average handle time is a measure of the average length of a customer’s call. It is a customer service metric used to improve operational efficiency in a contact center.
A good average handle time is generally considered to be 6 minutes long, but it depends on your company’s approach to customer experience, contact channel used, etc.
Keeping the customer call short doesn’t mean that you can skimp out by giving the caller a hasty solution or response just to close the query fast. The customer needs to be satisfied (at the very least) with the resolution.
3) Call abandonment rate
Call abandonment rate is a percentage measure of how many inbound callers drop a call or hang up before they are connected to an agent. The acceptable range for abandonment rate is typically around 2% to 5% and indicates that the center is performing well and managing inbound calls effectively.
Some of the best ways to reduce call abandonment rates are through adequate staffing, minimizing wait times, estimated wait time announcements, offering callback options, improving the self-service options, and regular agent training.
4) Service level (SL)
Call center service level is a measure of a contact center’s efficiency and responsiveness towards incoming customer requests within a specific time frame. It checks the performance and quality of service, or how well the center is meeting customer expectations.
The industry standard for call center service level is the 80/20 rule answering 80% of inbound calls in 20 minutes.
Agent performance metrics
1) Agent utilization rate
Agent utilization is a workforce management metric that shows agent productivity. It, essentially, quantifies an agent’s productive hours compared to their total working hours in a day. Productive hours are those that the agent spends handling customer calls and completing other work-related tasks. Agent utilization rate is a ratio calculated by dividing agent work produced with their work capacity.
For better productivity, you can balance the agent’s workload by:
- Setting clear goals
- Creating a structured work schedule
- Using the latest technology
- Fostering a collaborative work environment
- Providing training and development
- Implementing a feedback loop
- Encouraging work-life balance
2) Quality assurance (QA) scores
Quality assurance (QA) scores (CQA scores) are a way to assess the quality and effectiveness of customer service interactions (usually in a call center). The score helps evaluate agent performance and customer interactions against a predetermined set of criteria so contact centers can improve service quality and customer satisfaction.
One of the best ways to ensure service quality is to use call monitoring software. These tools help in:
- Real-time monitoring and intervention through:
- Live call monitoring : Supervisors listen in on ongoing calls so they can provide guidance and support in real time.
- Call barging : Supervisors can join live calls without the customer’s knowledge, to train, troubleshoot, or ensure quality.
- Call whispering: The supervisor communicates directly with an agent during a live interaction to provide coaching or assistance without the customer hearing them.
- Identifying the agent’s strengths and weaknesses through:
- Performance evaluation: Based on call quality, customer satisfaction, and adherence to the scripts.
- Identifying instances for coaching: To improve their skills or knowledge.
- Data-driven insights: Tracking different metrics for various areas of improvement.
- Improving training and development:
- Recording calls: Agents can learn from their mistakes and improve their skills.
- Targeted coaching: Supervisors identify areas of improvement to provide training.
- Compliance and quality: Ensuring compliance and quality on the part of the agent for overall call quality and customer satisfaction.
- Improving customer satisfaction:
- Proactive problem solving : Potential issues are identified early so supervisors can intervene and prevent them from escalating.
- Empowering agents : Handle tough customer interactions and quickly resolve issues.
- Streamlining the process : The software identifies inefficiencies in call handling.
Overall, call monitoring software increases an agent’s confidence, skill, efficiency, and first-contact resolution rates.
4) Call transfer rate (CTR)
CTR is a percentage measure of the number of calls that get transferred from one agent to another. Transfers can be made upon the request of the customer if the issue is escalated to a senior or for completion by a specialist team.
Ideally, the transfer rate should be below 15% of the call volume. If you have a high CTR, say about 35%, it’s a sign that customers are not getting satisfactory answers in the first contact or call. So, you need to improve your first-contact resolution rates.
Financial metrics
Cost per call (CPC)
Cost per call is a performance metric used to measure the average cost of handling a singular customer interaction (phone call or otherwise). It is calculated by dividing the total costs involved in operating a call center by the number of inbound and outbound calls.
In a typical call center, the costs can include those related to infrastructure (including any leasing), payroll, utilities, software, and support services.
How to reduce call center operational costs
- Optimizing the workforce
- Using IVR automation
- Implementing self-service options
- Using AI-powered chatbots
- Implementing quality control measures, etc.
AI-driven metrics
Modern-day call center software often come with AI-powered tools that automate data analysis and reporting. They quickly analyze customer interactions to give managers an insight into customer satisfaction and agent efficiency. AI also helps optimize call routing, self-service options, and automation of routine tasks so that all the activities are productive and customers are satisfied with the service quality.
Best practices for improving call center metrics
After learning about the various call center performance metrics, you should know what best practices to follow to improve your call center metrics.
- Using the data from the metrics to set realistic and achievable goals.
- Use the data to locate areas that need improvement.
- Track and monitor your progress over time.
- Implement real-time performance dashboards for faster decision-making and quicker problem resolution.
- Training the agents to resolve issues in the first contact to reduce call transfers and FCR.
- Using workforce management software to better agent utilization and improved productivity.
Common challenges and solutions
Challenge 1: How to improve call center efficiency?
One of the biggest challenge for call centers is juggling a limited staff, managing large call volumes, and providing quality customer service at the same time. Luckily, it is not an impossible task to manage.
Solution:
- Implementing intelligent call routing so callers are always directed to the most qualified agents based on their skills and availability.
- Using interactive voice response (IVR) systems to help resolve common or simple queries without the need to interact with an agent.
- Automating routine tasks with AI chatbots and self-service options to reduce call volumes and free up agents to handle for complex issues.
- Providing continuous agent training on communication skills, product knowledge, and technical tools for better agent performance.
Challenge 2: How to reduce average handle time (AHT)?
AHT is an important call center metric and it is crucial to reduce it without compromising on service quality.
Solution:
- Optimizing the call scripts and knowledge base to help agents resolve queries faster.
- Encouraging active listening and first-contact resolution (FCR) so they can resolve issues in just one interaction, minimizing repeat calls.
- Using AI-powered call summarization to transcribe and summarize calls in real time, reducing the agent’s workload.
- Integrating CRM so agents can retrieve relevant information instantly, further reducing response times.
Challenge 3: How to measure and benchmark call center performance?
Knowing the right metrics to track is just the beginning of making your call center run efficiently. What’s really important is what benchmarks to use? Do you set a benchmark based on your goals or based on the performance of your competition and the overall industry?
Solution:
We’ve already gone through the necessary KPIs in the previous section. Once you know what metrics to track, set your performance benchmark. Compare yourself with your competitors or the industry benchmarks to make it easier to where you lack and how you can improve areas for improvement.
Use the latest call center technology, optimize processes, and continuously monitor your KPIs, to overcome call queuing challenges and improve your center’s overall performance.
To wrap it up
Performance tracking is an inescapable part of any department. Without analyzing efficiency and performance, you might as well be throwing your money at the wall. Call centers are no exception. We must measure performance to ensure that it is doing what it’s supposed to – providing quality customer service.
Call centers need to have operational efficiency and agent productivity to keep customers satisfied. Tracking key call center performance metrics, like customer satisfaction, first call resolution, average handle time, and service level, and thorough call center analytics can help identify areas for improvement and implement strategies to enhance customer experiences.
Stay proactive and data-focused so your call center can consistently deliver top-quality customer support, all the while maintaining cost efficiency and high agent performance.
Contact us today for more information on effective call center management or if you would like to outsource your customer support needs to a call center service provider.